Your Building Is Already 48% Pre-Manufactured
Part one of two: Introducing a standardized way to measure prefabricated value and cost in construction
If you sit in enough planning meetings where prefab is considered, you will hear some version of this: “prefab is not worth it”, or “prefab cannot be financed.” There are two mistakes in these statements. First, there is an assumption that a building starts at zero prefabrication, when about half its value is already factory-made. And second, prefabrication is treated as a single, yes-or-no, decision, when prefab is actually a spectrum.
Canada is pushing to become a leader in industrialized construction. With the most recent announcements by Build Canada Homes (BCH) to support housing projects that utilize some form of prefabrication, it’s becoming increasingly important that the construction industry agrees on a measure that will allow all parties to understand the level of prefabrication as well as the actual effect on construction budgets and timelines.
In the UK, the government adopted the calculation of Pre-Manufactured Value (PMV) with the help of Cast Consultancy. The PMV is defined as the percentage of construction cost incurred prior to the final installation on site. At the current baseline, a high-rise apartment building built on site by conventional trades, is already about 48% “pre-manufactured”. Every window, sheet of gypsum, or length of rebar was made in a factory and delivered to site. It’s not called prefab, and that’s where the confusion starts.
Two things need to change: How we define “prefab” when looking at the baseline and potentials of industrialized construction, and how we finance construction as the share of prefabrication rises in the future. PMV needs to be combined with a second metric to clarify the impact of prefabricated components.
Where the confusion comes from
The question developers and lenders actually ask about a prefabricated system is when the money goes out, and what that does to the equity. Often, it’s not understood what impact a specific prefabricated system has on the construction budget, the cashflow, and the timeline.
When a developer hears that prefab front-loads most of the budget, they will likely conclude the cash flow won’t work. However, choosing to go with just one prefabricated component (such as interior walls or a closed-wall envelope) may influence only 5 to 15% of the total construction budget and similar payment terms as traditional construction.
What we can already measure: Pre-Manufactured Value (PMV)
PMV is the most serious attempt to measure the share of a project’s construction cost delivered through pre-manufacturing. It sits within a seven-category framework that runs from volumetric modules through panelized systems to non-structural assemblies and site process improvements. However, it calculates all materials and products that are made off-site, therefore bringing the baseline close to half of a traditional construction budget.
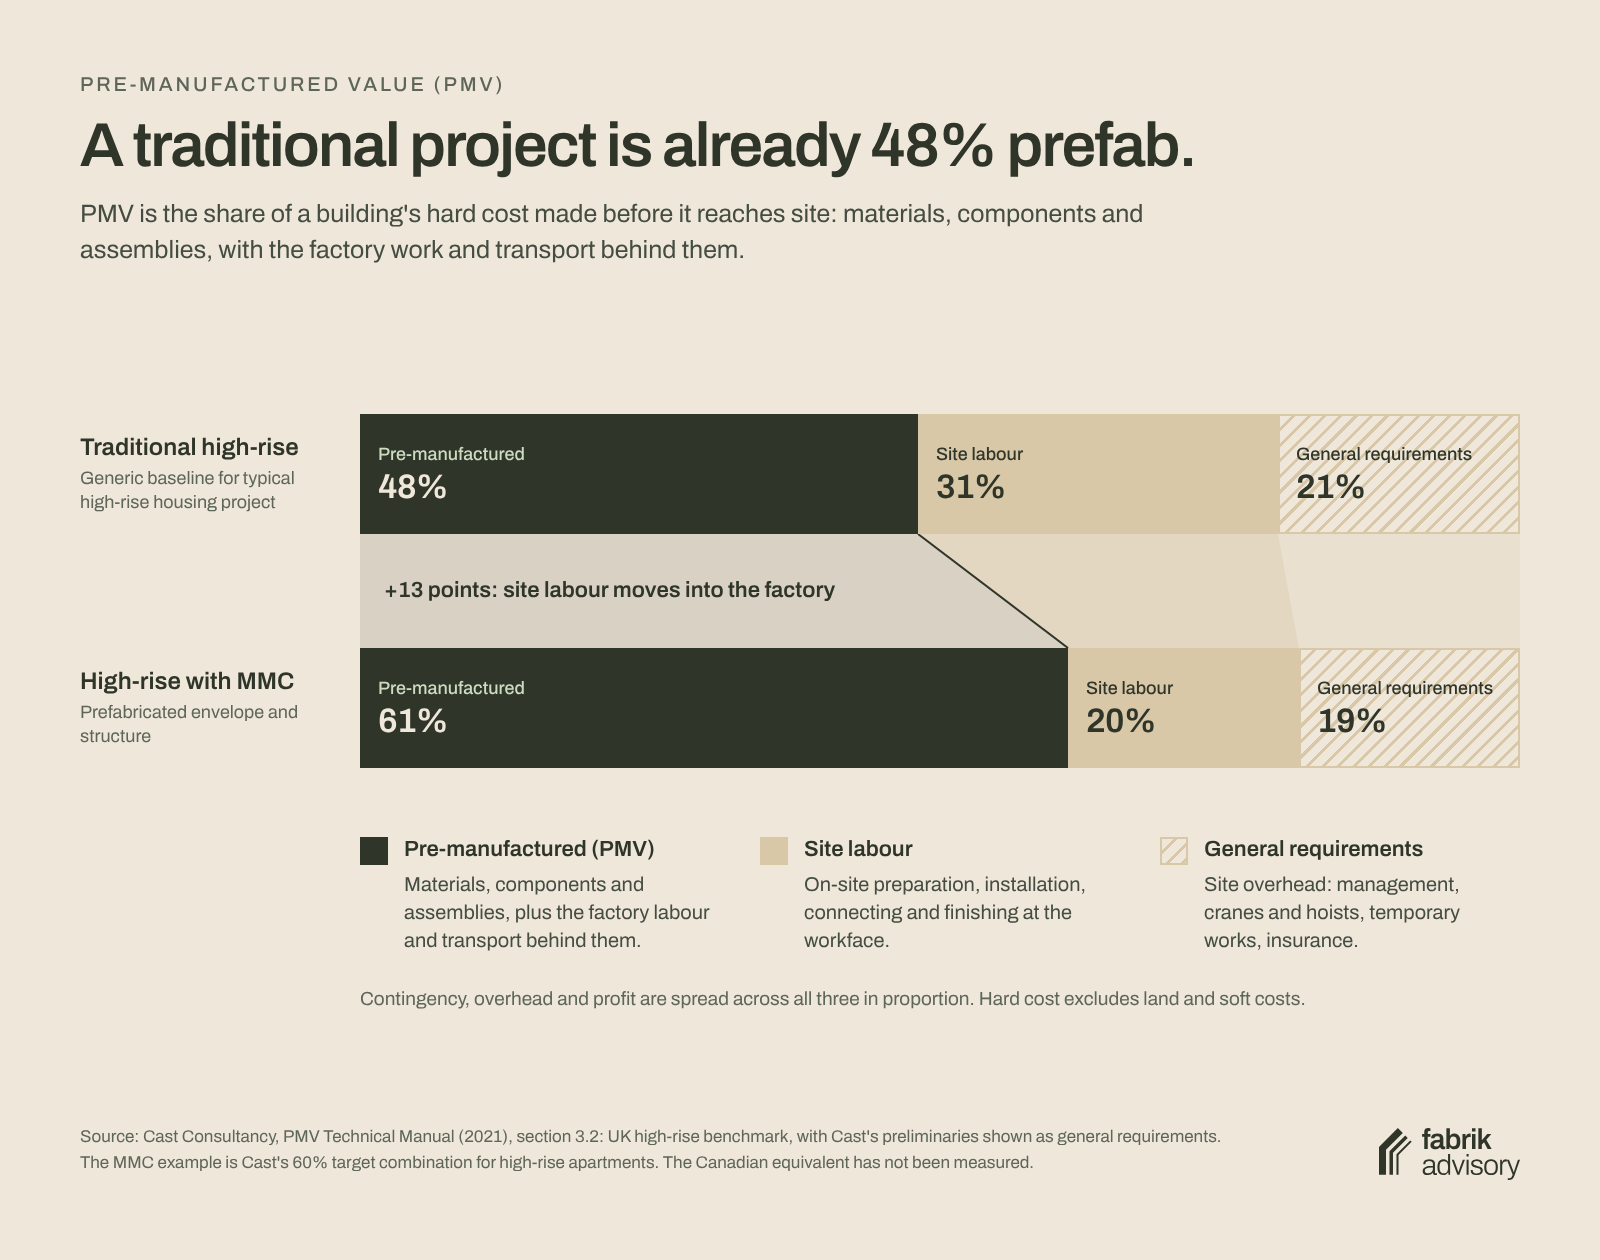
The baselines for traditional construction in the UK, from the PMV Technical Manual:
| Building type | Baseline PMV, traditional construction |
|---|---|
| Housing | 40% |
| Low-rise apartments | 42% |
| Mid-rise apartments | 44% |
| High-rise apartments | 48% |
Note: These are UK benchmarks, and the Canadian equivalent may be different depending on the relationship between material costs and labour costs on site.
While this is a great framework, it has been difficult to track what truly changes the PMV, mostly because every supplier has different products that influence the PMV in different ways.
What PMV cannot tell you
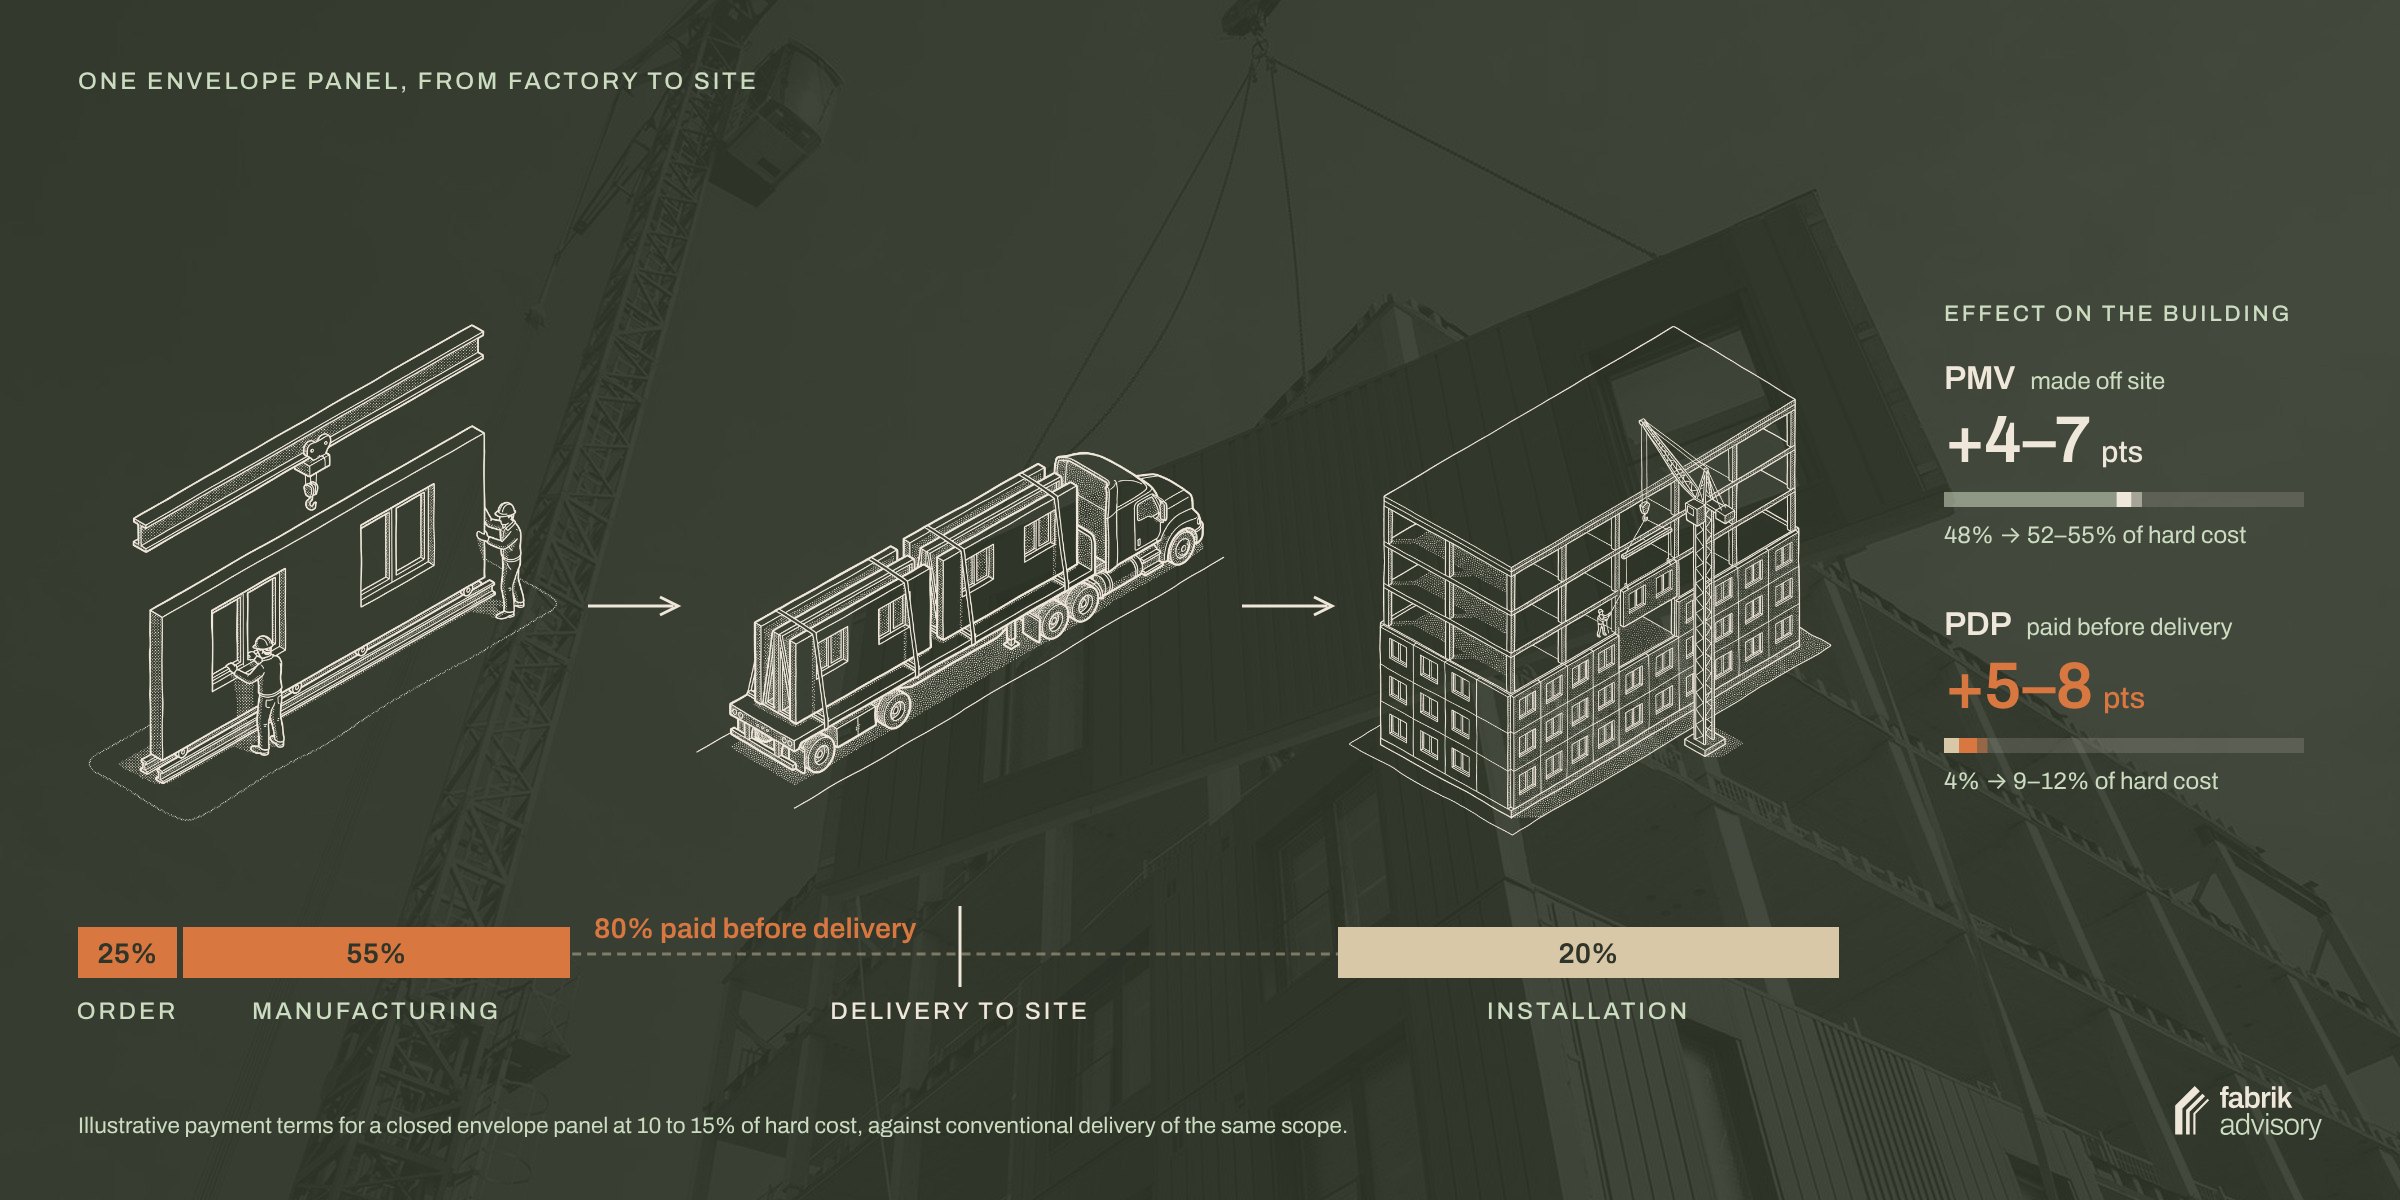
Take a closed-wall envelope panel with windows installed as an example. Built conventionally, the windows, insulation, membranes, cladding and framing material are already prefabricated. Manufacturing the whole panel only moves processing and most of the assembly and installation labour into the factory as well.
In PMV terms, that adds roughly 4 to 7 points to the building’s pre-manufactured share. A modest move.
In payment terms, the move is larger. A typical contract for this kind of system could ask for 25% at order, 55% across manufacturing and 20% at installation, with holdback on top. That puts 80% of the component’s value on the books before the first panel reaches site. The same scope built conventionally carries 25 to 35% before delivery, mostly for window deposits and fabrication payments.
As a result, the same envelope adds a few points of PMV, while its pre-delivery payments jump from about 30% to 80%. The two figures move independently but the industry publishes only the first, if at all. I suspect this gap is where the misunderstanding comes from: people want a cash flow number but only find a value-share number.
Introducing a second measure: Pre-Delivery Payments (PDP)
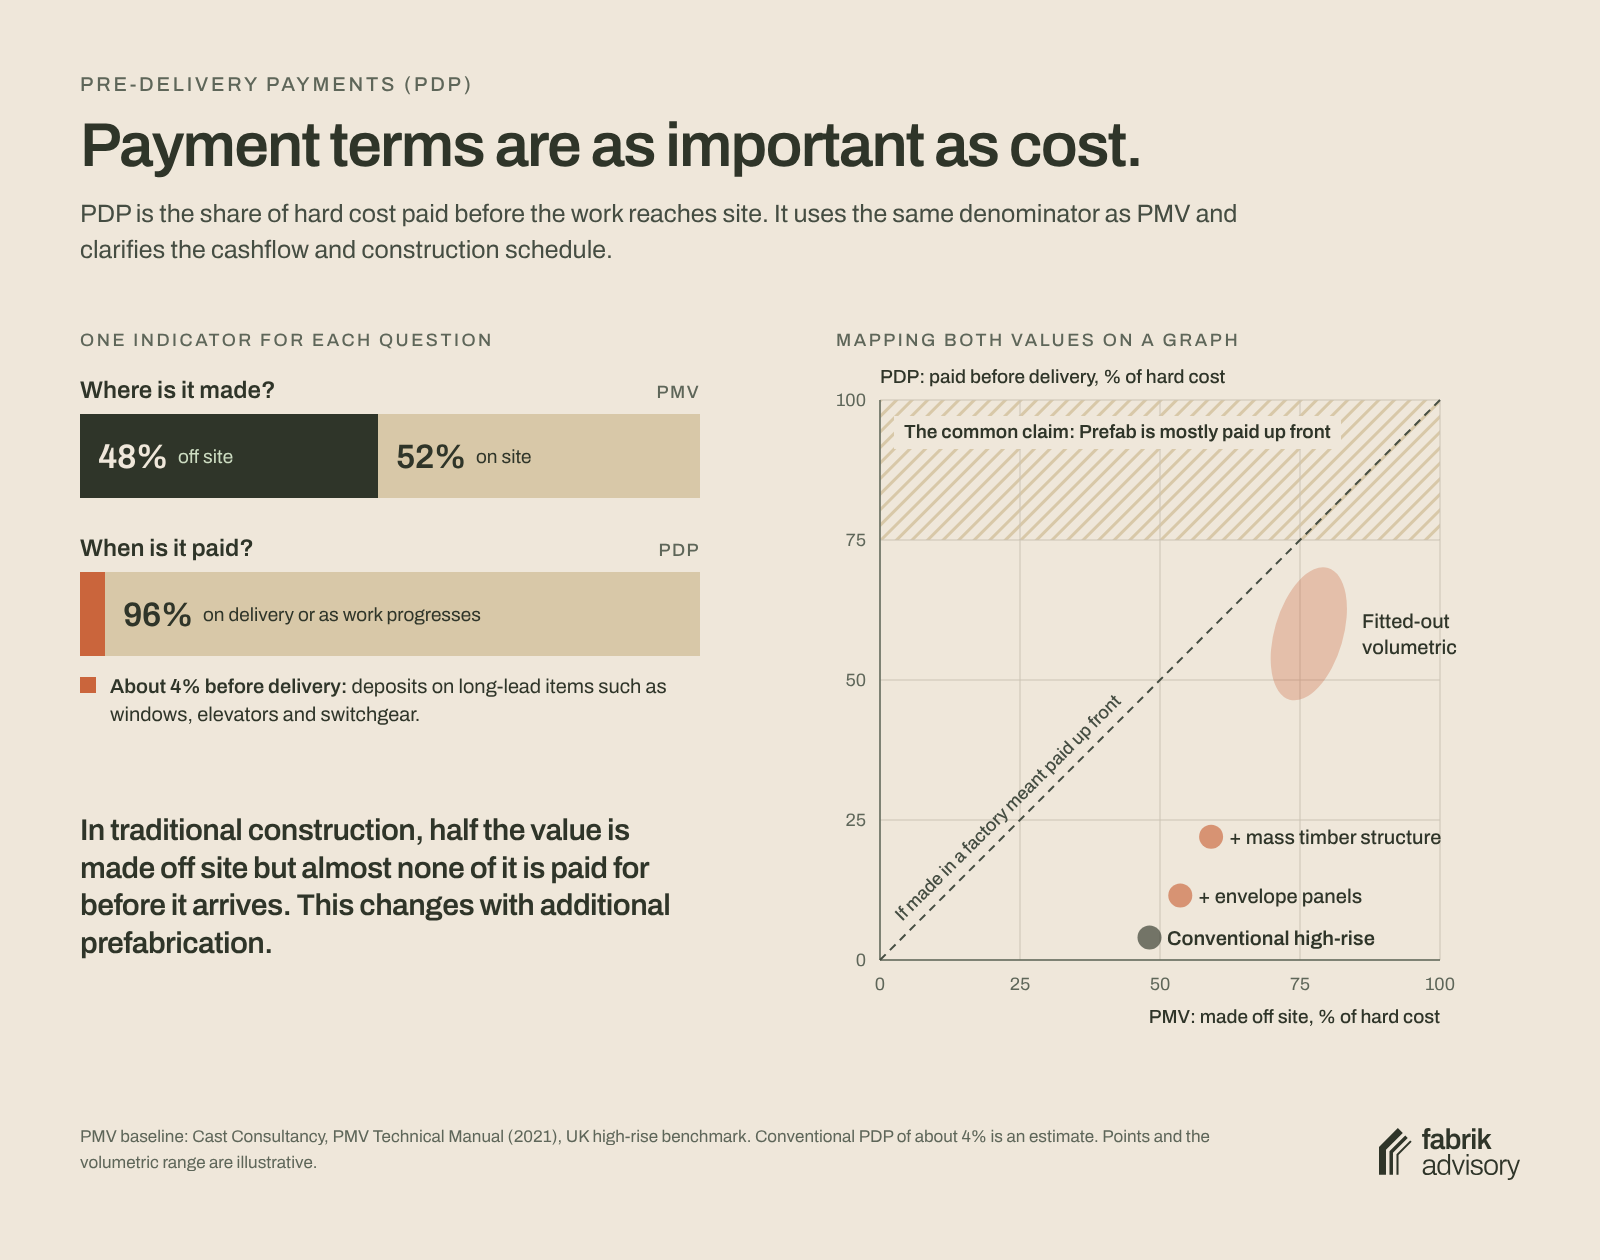
Alongside PMV, the industry needs a second number measured against the same denominator. I propose calling it Pre-Delivery Payments (PDP): the share of construction cost that is contractually payable before the work reaches site.
PDP shift = the component’s share of hard cost × (its pre-delivery terms − conventional pre-delivery terms for the same scope)
Example: closed-wall envelope panels - 15% × (80% − 30%) ≈ 7.5 points
Using the same denominator means the two numbers can be read side by side and added up across components. At the component level, the input is the component’s pre-delivery terms: the share of its own contract value payable before delivery. Its effect on the project is the share of construction cost it replaces, multiplied by the change in those terms against conventional procurement of the same scope.
Like PMV, PDP has a baseline above zero. Conventional construction already pays deposits or progress draws for long-lead items before they arrive, such as windows, elevators, and major mechanical equipment. On my estimate that can land anywhere between roughly 3 and 6% of construction cost for a conventional high-rise.
Let’s apply this to the envelope example. A scope worth about 15% of construction cost moves payments from roughly 30% to 80% pre-delivery, shifting total PDP by about 8 points. The building goes from around 4% of its budget paid before delivery to around 12%. On top of that, choosing this particular component will change the total construction length, influencing overall cashflow and interest paid.
A common terminology for prefabricated components
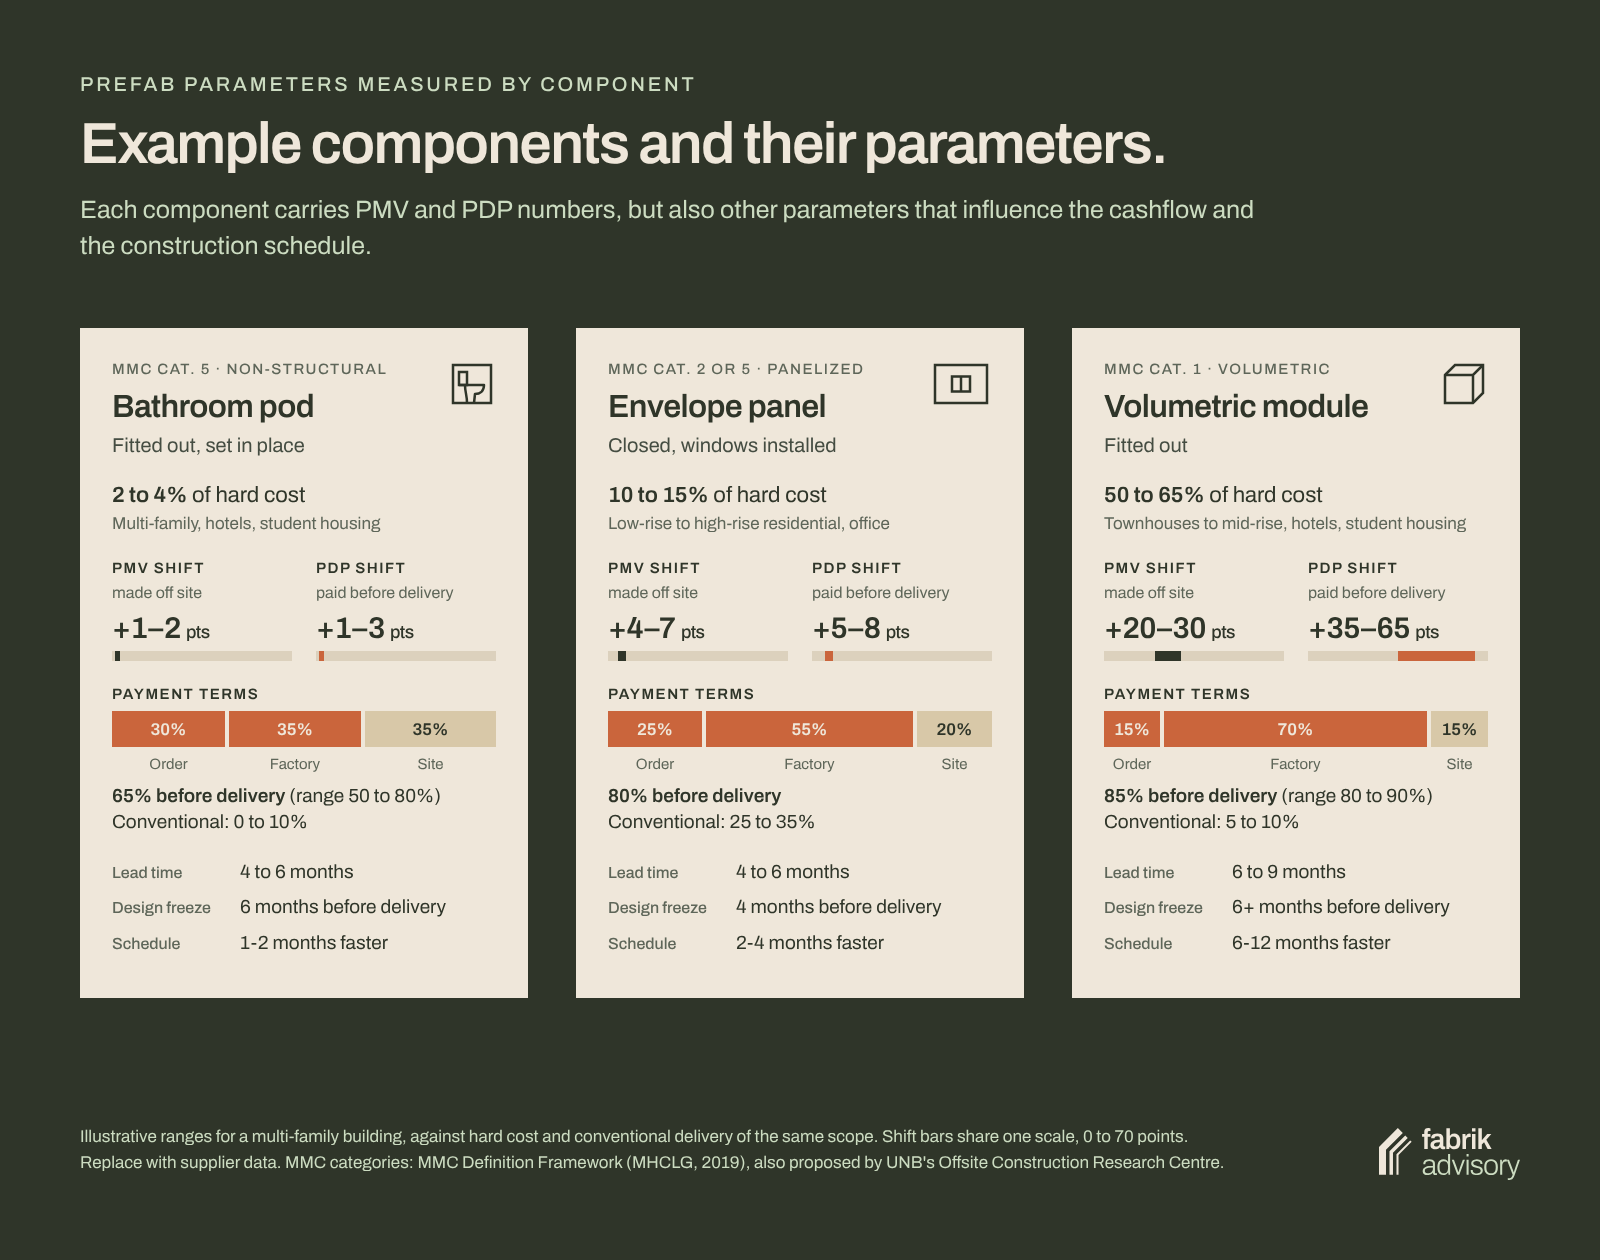
Prefab is not a yes/no question but a set of components, where each carries its own pair of PMV/PDP numbers. If we agree on this set of terminologies, each supplier can easily describe their prefabricated component by its impact on the conventional construction cost, cashflow, and timeline.
Below are three example components that represent different prefab choices. The ranges are illustrative, built from typical elemental cost splits for a Canadian multi-family building and the Cast framework.
This also moves the discussion away from a broad categorization to the real value of different products that are currently being offered by different companies. Wall panels, partitions, bathroom pods, and riser modules, each move a building’s pre-delivery exposure by a few points and impact the construction timeline. Only fully fitted volumetric modules, or a combination of several prefabricated components, will go beyond half the budget.
What makes prefabricated components comparable
I expect the next several years to bring many more component specialists: bathroom and kitchen pods, partition systems, MEP modules, cores, envelope and floor systems, combined project by project. The market will not settle into traditional versus all-prefab. A market of combinable components needs a common way to compare them, and these two numbers would do most of the work.
For each component, a supplier of a prefabricated building system could publish:
- PMV contribution and PDP share, both against total construction cost
- Pre-delivery terms: payment milestone with its percentage and its trigger
- Lead time from contract to first delivery, and the design freeze it requires
- Install rate and effect on the construction schedule
- Whether it offers bonding, escrow or title transfer at manufacturing milestones
This will allow manufacturers of similar components to compete on several and clearly defined terms, and it lowers the barrier to entry while enabling developers and builders to choose the right mix of prefab.
How much further to go
Your project is already about half pre-manufactured. The real question is how much further to go, and where along that range value, time savings, and risk balance for a specific project. The entry point is lower than most people assume, but the effect on the cashflow and the construction timeline needs to be understood. In part two of this series, we will model that on a worked example and I will introduce a free tool that runs the numbers on your own cost plan.
Component ranges are illustrative and show relative effects. They are not a cost benchmark.
Sources: Cast Consultancy, PMV Technical Manual, UNB OCRC MMC Framework